contents area
Press Release
detail content area
- Date2020-03-10 18:32
- Update2020-03-11 13:38
- DivisionDivision of Risk assessment and International cooperation
- Tel043-719-7553
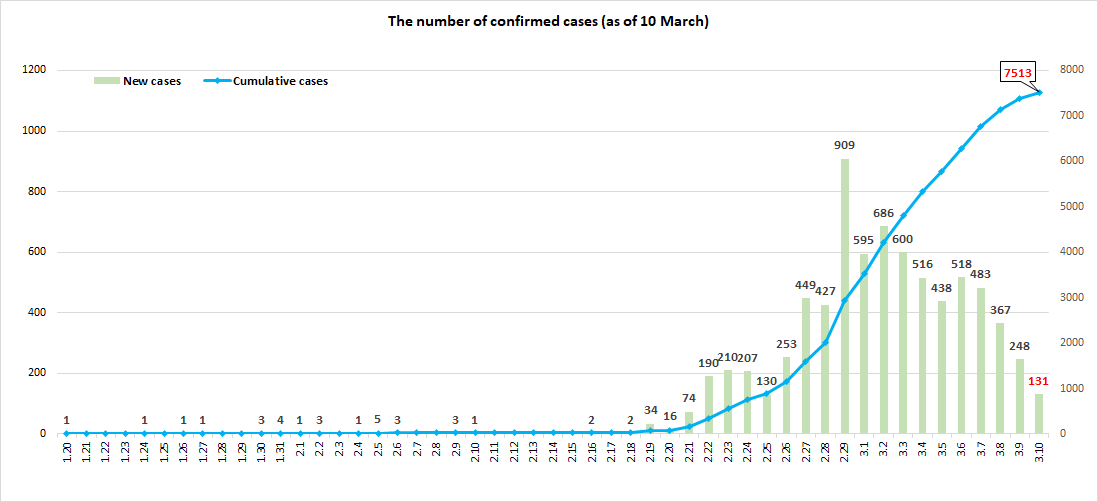
○ As of 0:00, 10 March, 2020, The total number of confirmed cases is 7,513 with 247 cases discharged from isolation.
|
Period (since 3 January) |
Total |
Confirmed cases |
Suspected cases |
|||||
|
Sub total |
discharged |
isolated |
Deceased |
Sub total |
being tested |
tested negative |
||
|
As of 0:00, 9. March. |
196,618 |
7,382 |
166 |
7,165 |
51 |
189,236 |
17,458 |
171,778 |
|
As of 0:00, 10 March |
210,144 |
7,513 |
247 |
7,212 |
54 |
202,631 |
18,452 |
184,179 |
|
Differences |
+13,526 |
+131 |
+81 |
+47 |
+3 |
+13,395 |
+994 |
+12,401 |
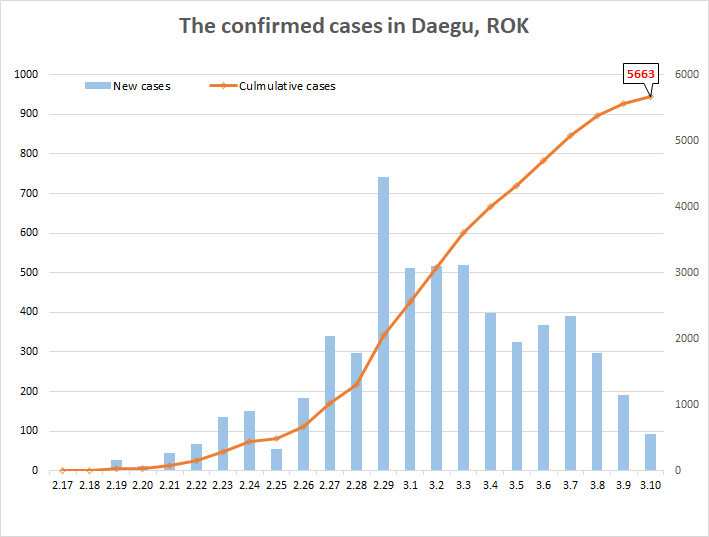
○ The regional distribution of total confirmed cases are as follows.
|
|
City |
|||||||||||||||
|
Seoul |
Busan |
Daegu |
Incheon |
Gwangju |
Daejeon |
Ulsan |
Sejong |
|||||||||
|
Isolated |
110 |
86 |
5,533 |
10 |
12 |
17 |
23 |
8 |
||||||||
|
Discharged |
31 |
10 |
92 |
3 |
3 |
1 |
1 |
0 |
||||||||
|
Deceased |
0 |
0 |
38 |
0 |
0 |
0 |
0 |
0 |
||||||||
|
Sub-total |
141 |
96 |
5,663 |
13 |
15 |
18 |
24 |
8 |
||||||||
|
Differences |
(11) |
(0) |
(92) |
(4) |
(0) |
(-1) |
(0) |
(2) |
||||||||
|
|
Province |
|||||||||||||||
|
Gyeong-gi |
Gang -won |
Chung -buk |
Chung- nam |
Jeon -buk |
Jeon -nam |
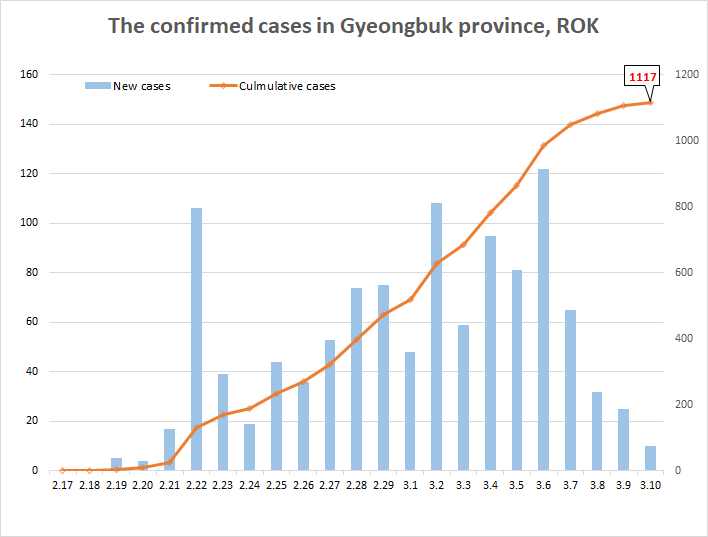
Gyeong-buk |
Gyeong-nam |
Jeju |
||||||||
|
Isolated |
140 |
21 |
22 |
103 |
5 |
3 |
1,043 |
73 |
3 |
|||||||
|
Discharged |
22 |
6 |
3 |
1 |
2 |
1 |
60 |
10 |
1 |
|||||||
|
Deceased |
1 |
1 |
0 |
0 |
0 |
0 |
14 |
0 |
0 |
|||||||
|
Sub-total |
163 |
28 |
25 |
104 |
7 |
4 |
1,117 |
83 |
4 |
|||||||
|
Differences |
(11) |
(0) |
(0) |
(2) |
(0) |
(0) |
(10) |
(0 |
(0) |
|||||||
|
|
||||||||||||||||
○ Cases Distribution by region
|
Region |
No. of cases |
(%) |
Incidence rate(per 0.1M) |
Region |
No. of cases |
(%) |
Incidence rate(per 0.1M) |
|
Seoul |
141 |
(1.88) |
1.45 |
Gyeonggi |
163 |
(2.17) |
1.23 |
|
Busan |
96 |
(1.28) |
2.81 |
Gangwon |
28 |
(0.37) |
1.82 |
|
Daegu |
5,663 |
(75.38) |
232.42 |
Chungbuk |
25 |
(0.33) |
1.56 |
|
Incheon |
13 |
(0.17) |
0.44 |
Chungnam |
104 |
(1.38) |
4.90 |
|
Gwangju |
15 |
(0.20) |
1.03 |
Jeonbuk |
7 |
(0.09) |
0.39 |
|
Daejeon |
18 |
(0.24) |
1.22 |
Jeonnam |
4 |
(0.05) |
0.21 |
|
Ulsan |
24 |
(0.32) |
2.09 |
Gyeongbuk |
1,117 |
(14.87) |
41.95 |
|
Sejong |
8 |
(0.11) |
2.34 |
Gyeongnam |
83 |
(1.10) |
2.47 |
|
|
|
|
|
Jeju |
4 |
(0.05) |
0.60 |
|
|
|
|
|
Total |
7,513 |
(100.0) |
14.49 |
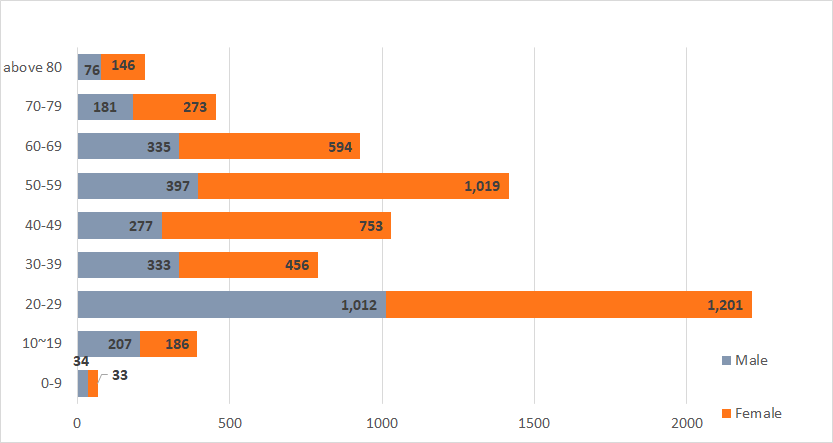
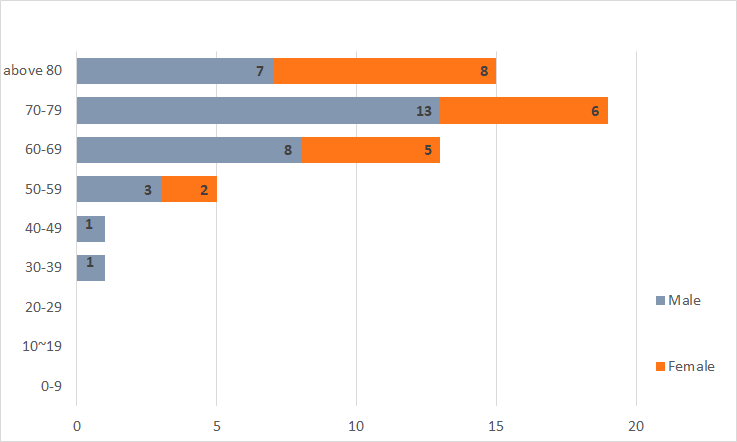
○ Cases Distribution by gender and age
|
Classification |
Cases |
(%) |
Death cases |
(%) |
Fatality rate (%) |
|
|
Total |
7,513 |
(100.0) |
54 |
(100.0) |
0.7 |
|
|
Sex |
Male |
2,852 |
(38.0) |
33 |
(61.1) |
1.2 |
|
Female |
4,661 |
(62.0) |
21 |
(38.9) |
0.5 |
|
|
Age |
above 80 |
222 |
(3.0) |
15 |
(27.8) |
6.8 |
|
70-79 |
454 |
(6.0) |
19 |
(35.2) |
4.2 |
|
|
60-69 |
929 |
(12.4) |
13 |
(24.1) |
1.4 |
|
|
50-59 |
1,416 |
(18.8) |
5 |
(9.3) |
0.4 |
|
|
40-49 |
1,030 |
(13.7) |
1 |
(1.9) |
0.1 |
|
|
30-39 |
789 |
(10.5) |
1 |
(1.9) |
0.1 |
|
|
20-29 |
2,213 |
(29.5) |
0 |
(0.0) |
- |
|
|
10-19 |
393 |
(5.2) |
0 |
(0.0) |
- |
|
|
0-9 |
67 |
(0.9) |
0 |
(0.0) |
- |
|
○ Age and Deaths distribution of cases
|
Age distribution of confirmed cases
|
Death distribution of confirmed cases |
○ Cases Distribution by Special management region
|
|
 |
 This public work may be used under the terms of the public interest source + commercial use prohibition + nonrepudiation conditions
