contents area
Press Release
detail content area
- Date2020-07-08 15:30
- Update2020-07-08 15:33
- Division Division of Risk assessment and International cooperation
- Tel043-719-7556
Updates on COVID-19 in Republic of Korea
8 July 2020
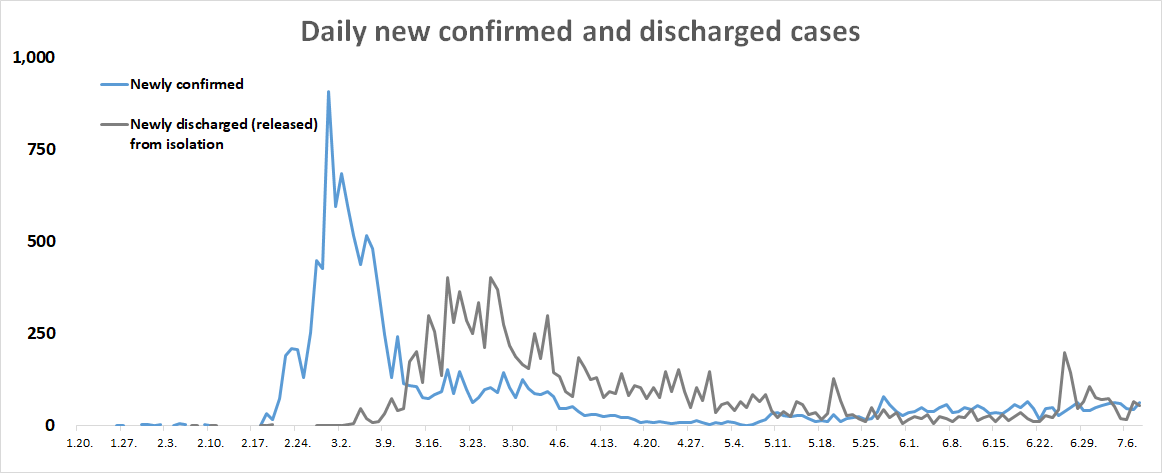
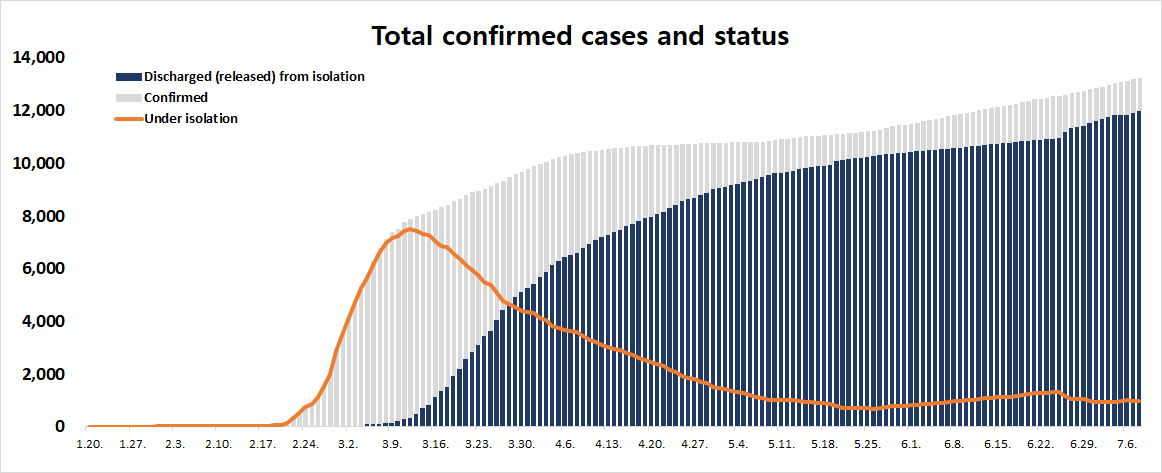
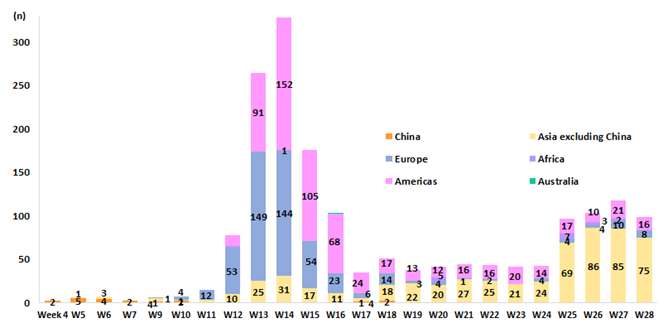
○ As of 0:00, 8 July 2020, the total number of confirmed cases is 13,224 (including 1,747 imported cases), of which 11,970 cases have been discharged from isolation. There are 30 new local cases, 33 new imported cases, and 0 new death.
|
Period (since 3 Jan) |
Total |
Tested positive (PCR) |
Testing in progress |
Tested negative (PCR) |
|||
|
Confirmed |
Discharged from isolation |
Under isolation |
Deceased |
||||
|
As of 0:00 7 July (Tues) |
1,346,194 |
13,181 |
11,914 |
982 |
285 |
23,675 |
1,309,338 |
|
As of 0:00 8 July (Wed) |
1,359,735 |
13,244 |
11,970 |
989 |
285 |
24,012 |
1,322,479 |
|
Difference |
(+)13,541 |
(+)63 |
(+)56 |
(+)7 |
- |
(+)337 |
(+)13,141 |
○ Regional distribution of confirmed cases:
|
|
Total |
City |
||||||||||||||||
|
Seoul |
Busan |
Daegu |
Incheon |
Gwangju |
Daejeon |
Ulsan |
Sejong |
|||||||||||
|
Isolated |
989 |
217 |
7 |
29 |
32 |
94 |
86 |
1 |
1 |
|||||||||
|
Discharged |
11,970 |
1,160 |
146 |
6,708 |
322 |
35 |
55 |
53 |
49 |
|||||||||
|
Deceased |
285 |
8 |
3 |
189 |
1 |
0 |
2 |
1 |
0 |
|||||||||
|
Subtotal |
13,244 |
1,385 |
156 |
6,926 |
355 |
129 |
143 |
55 |
50 |
|||||||||
|
Local* |
30 |
5 |
0 |
0 |
1 |
7 |
2 |
0 |
0 |
|||||||||
|
Imported* |
33 |
5 |
0 |
1 |
0 |
1 |
0 |
0 |
0 |
|||||||||
|
New |
63 |
10 |
0 |
1 |
1 |
8 |
2 |
0 |
0 |
|||||||||
|
|
Province |
Other |
||||||||||||||||
|
Gyeonggi |
Gangwon |
Chung-buk |
Chung- nam |
Jeon- buk |
Jeon- nam |
Gyeong- buk |
Gyeong-nam |
Jeju |
Border screening |
|||||||||
|
Isolated |
236 |
9 |
4 |
26 |
10 |
9 |
10 |
11 |
2 |
205 |
||||||||
|
Discharged |
1,055 |
55 |
62 |
153 |
22 |
19 |
1,330 |
129 |
18 |
599 |
||||||||
|
Deceased |
24 |
3 |
0 |
0 |
0 |
0 |
54 |
0 |
0 |
0 |
||||||||
|
Subtotal |
1,315 |
67 |
66 |
179 |
32 |
28 |
1,394 |
140 |
20 |
804 |
||||||||
|
Local* |
11 |
0 |
0 |
3 |
0 |
1 |
0 |
0 |
0 |
0 |
||||||||
|
Imported* |
7 |
0 |
0 |
3 |
2 |
0 |
1 |
2 |
0 |
11 |
||||||||
|
New |
18 |
0 |
0 |
6 |
2 |
1 |
1 |
2 |
0 |
11 |
||||||||
|
* Based on case data reported to the KCDC ※ Figures subject to correction based on findings from epidemiological investigations |
||||||||||||||||||
○ Case distribution by region:
|
Region |
New cases |
(%) |
Total cases |
(%) |
Incidence rate (per 100,000) |
|
Seoul |
10 |
(15.87) |
1,385 |
(10.46) |
14.23 |
|
Busan |
0 |
(0.00) |
156 |
(1.18) |
4.57 |
|
Daegu |
1 |
(1.59) |
6,926 |
(52.30) |
284.26 |
|
Incheon |
1 |
(1.59) |
355 |
(2.68) |
12.01 |
|
Gwangju |
8 |
(12.70) |
129 |
(0.97) |
8.86 |
|
Daejeon |
2 |
(3.17) |
143 |
(1.08) |
9.70 |
|
Ulsan |
0 |
(0.00) |
55 |
(0.42) |
4.79 |
|
Sejong |
0 |
(0.00) |
50 |
(0.38) |
14.61 |
|
Gyeonggi |
18 |
(28.57) |
1,315 |
(9.93) |
9.92 |
|
Gangwon |
0 |
(0.00) |
67 |
(0.51) |
4.35 |
|
Chungbuk |
0 |
(0.00) |
66 |
(0.50) |
4.13 |
|
Chungnam |
6 |
(9.52) |
179 |
(1.35) |
8.43 |
|
Jeonbuk |
2 |
(3.17) |
32 |
(0.24) |
1.76 |
|
Jeonnam |
1 |
(1.59) |
28 |
(0.21) |
1.50 |
|
Gyeongbuk |
1 |
(1.59) |
1,394 |
(10.53) |
52.36 |
|
Gyeongnam |
2 |
(3.17) |
140 |
(1.06) |
4.17 |
|
Jeju |
0 |
(0.00) |
20 |
(0.15) |
2.98 |
|
Border Screening |
11 |
(17.46) |
804 |
(6.07) |
- |
|
Total |
63 |
(100) |
13,244 |
(100) |
25.54 |
* Total (cumulative) number of cases reported since January 2020 by region / Population by region (based on resident registration data of the Ministry of the Interior as of January 2020)
* Incidence rate based on the number of confirmed cases with the address of the reporting institution
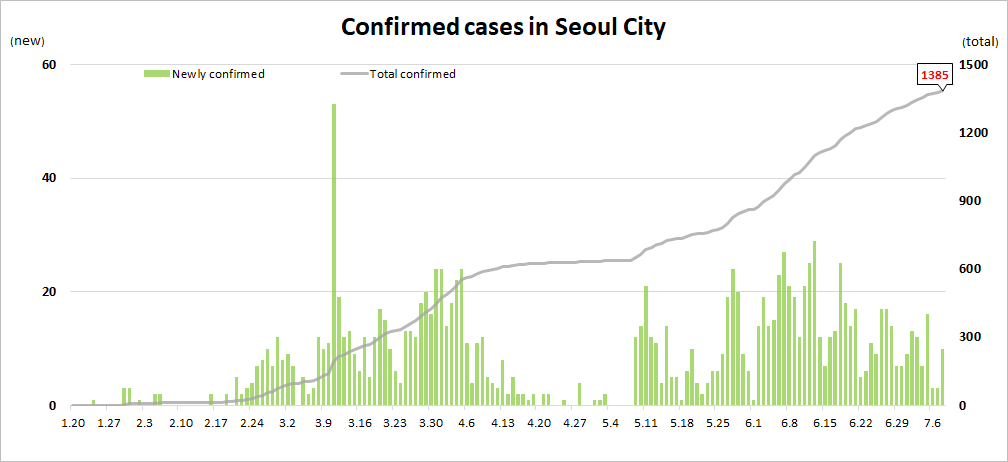
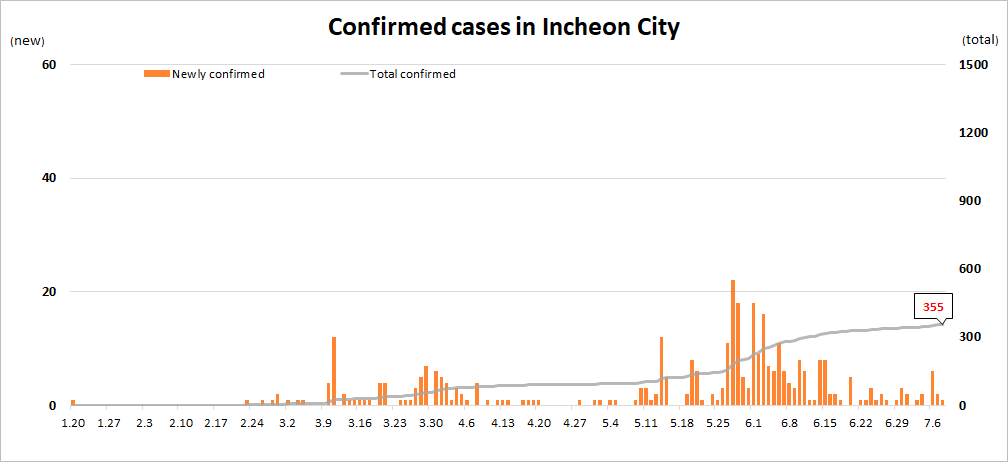
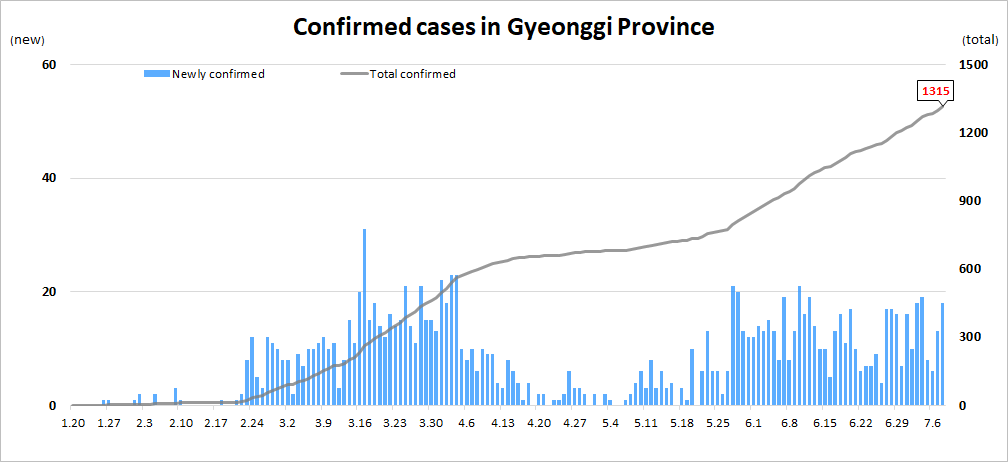
DAILY NEW AND TOTAL CASES IN SEOUL/INCHEON/GYEONGGI REGIONS
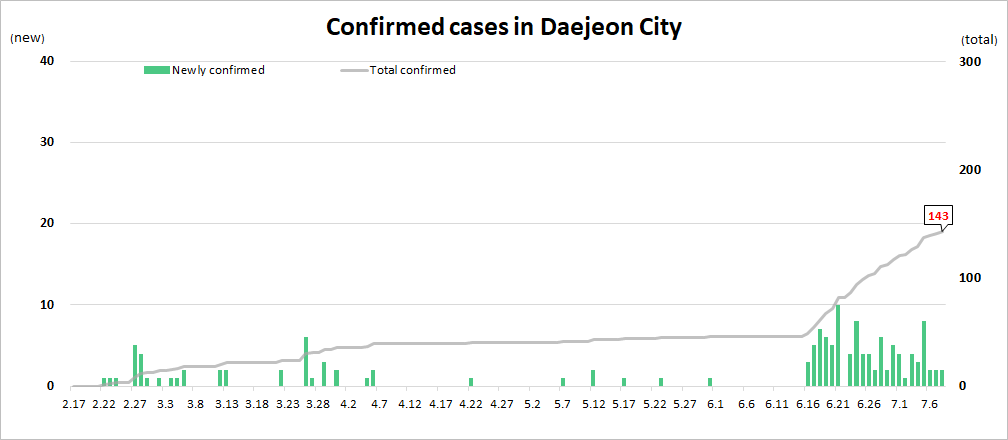
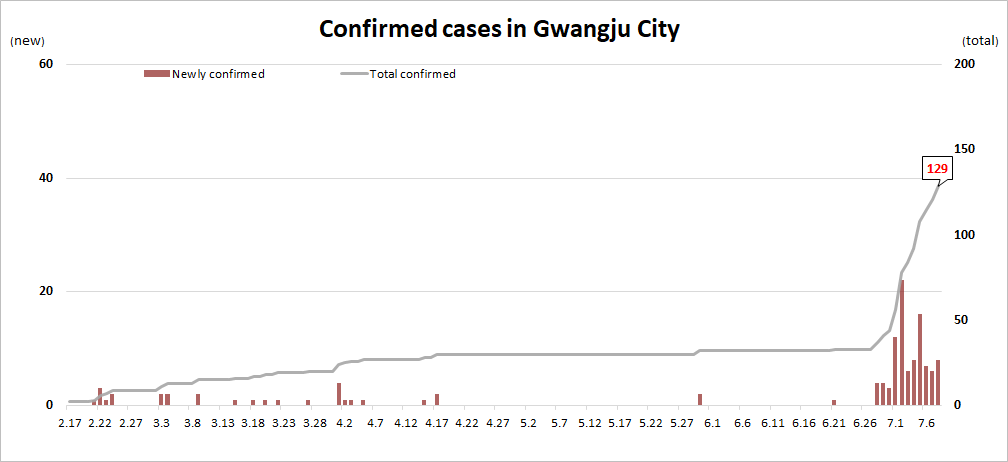
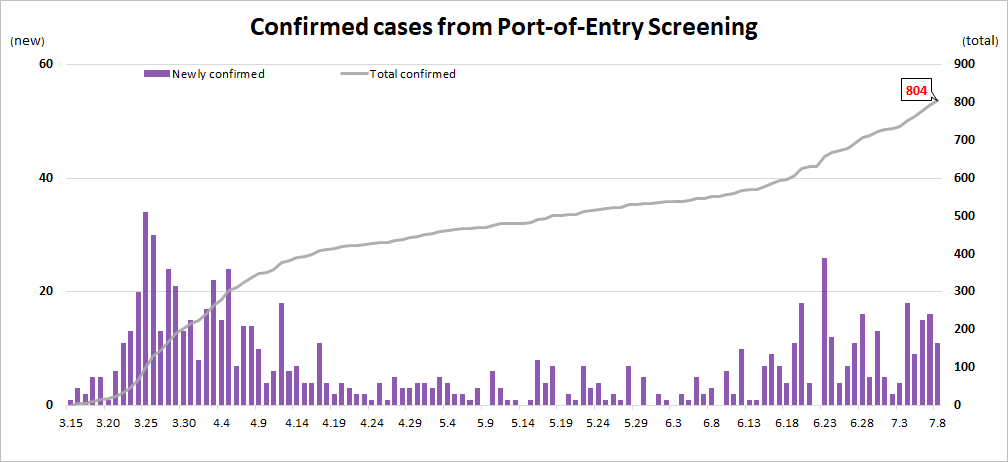
DAILY NEW AND TOTAL CASES IN DAEJEON / GWANGJU / BORDER SCREENING
○ Distribution by gender and age group:
|
Confirmed cases by gender and age group |
||||||||||||||||||||||||||||||||||||||||||||||||||||||||||||||||||||||||||||||||||
* Total (cumulative) number of cases reported since January 2020 by sex and age / Population by sex and age (based on resident registration data of the Ministry of the Interior as of January 2020)
|
||||||||||||||||||||||||||||||||||||||||||||||||||||||||||||||||||||||||||||||||||
|
Deaths by gender and age group |
||||||||||||||||||||||||||||||||||||||||||||||||||||||||||||||||||||||||||||||||||
|
||||||||||||||||||||||||||||||||||||||||||||||||||||||||||||||||||||||||||||||||||
* Case fatality rate (CFR) = Number of deaths / Number of confirmed cases x 100
IMPORTED CONFIRMED CASES
 This public work may be used under the terms of the public interest source + commercial use prohibition + nonrepudiation conditions