contents area
Public Health Weekly Report
detail content area
<Non-Communicable Disease (NCD) Statistics> Trends in Nonalcoholic Beverage Consumption; 2007-2017
- Date2019-08-08 21:50
- Update2019-11-19 18:48
- DivisionDivision of Strategic Planning for Emerging Infectious Diseases
- Tel043-719-7271
Trends in Nonalcoholic Beverage Consumption; 2007-2017
Compared to other food groups, beverages are low in essential nutrients, such as protein, vitamins, and minerals, and high in energy (e.g., from sugars and stimulants). Therefore, most food guides recommend decreasing beverage consumption. However, between 2007-2017, nonalcoholic beverage consumption more than tripled (see Figure 1), with the highest consumption in 2017, occurring among men and women in their 20s (see Figure 2).
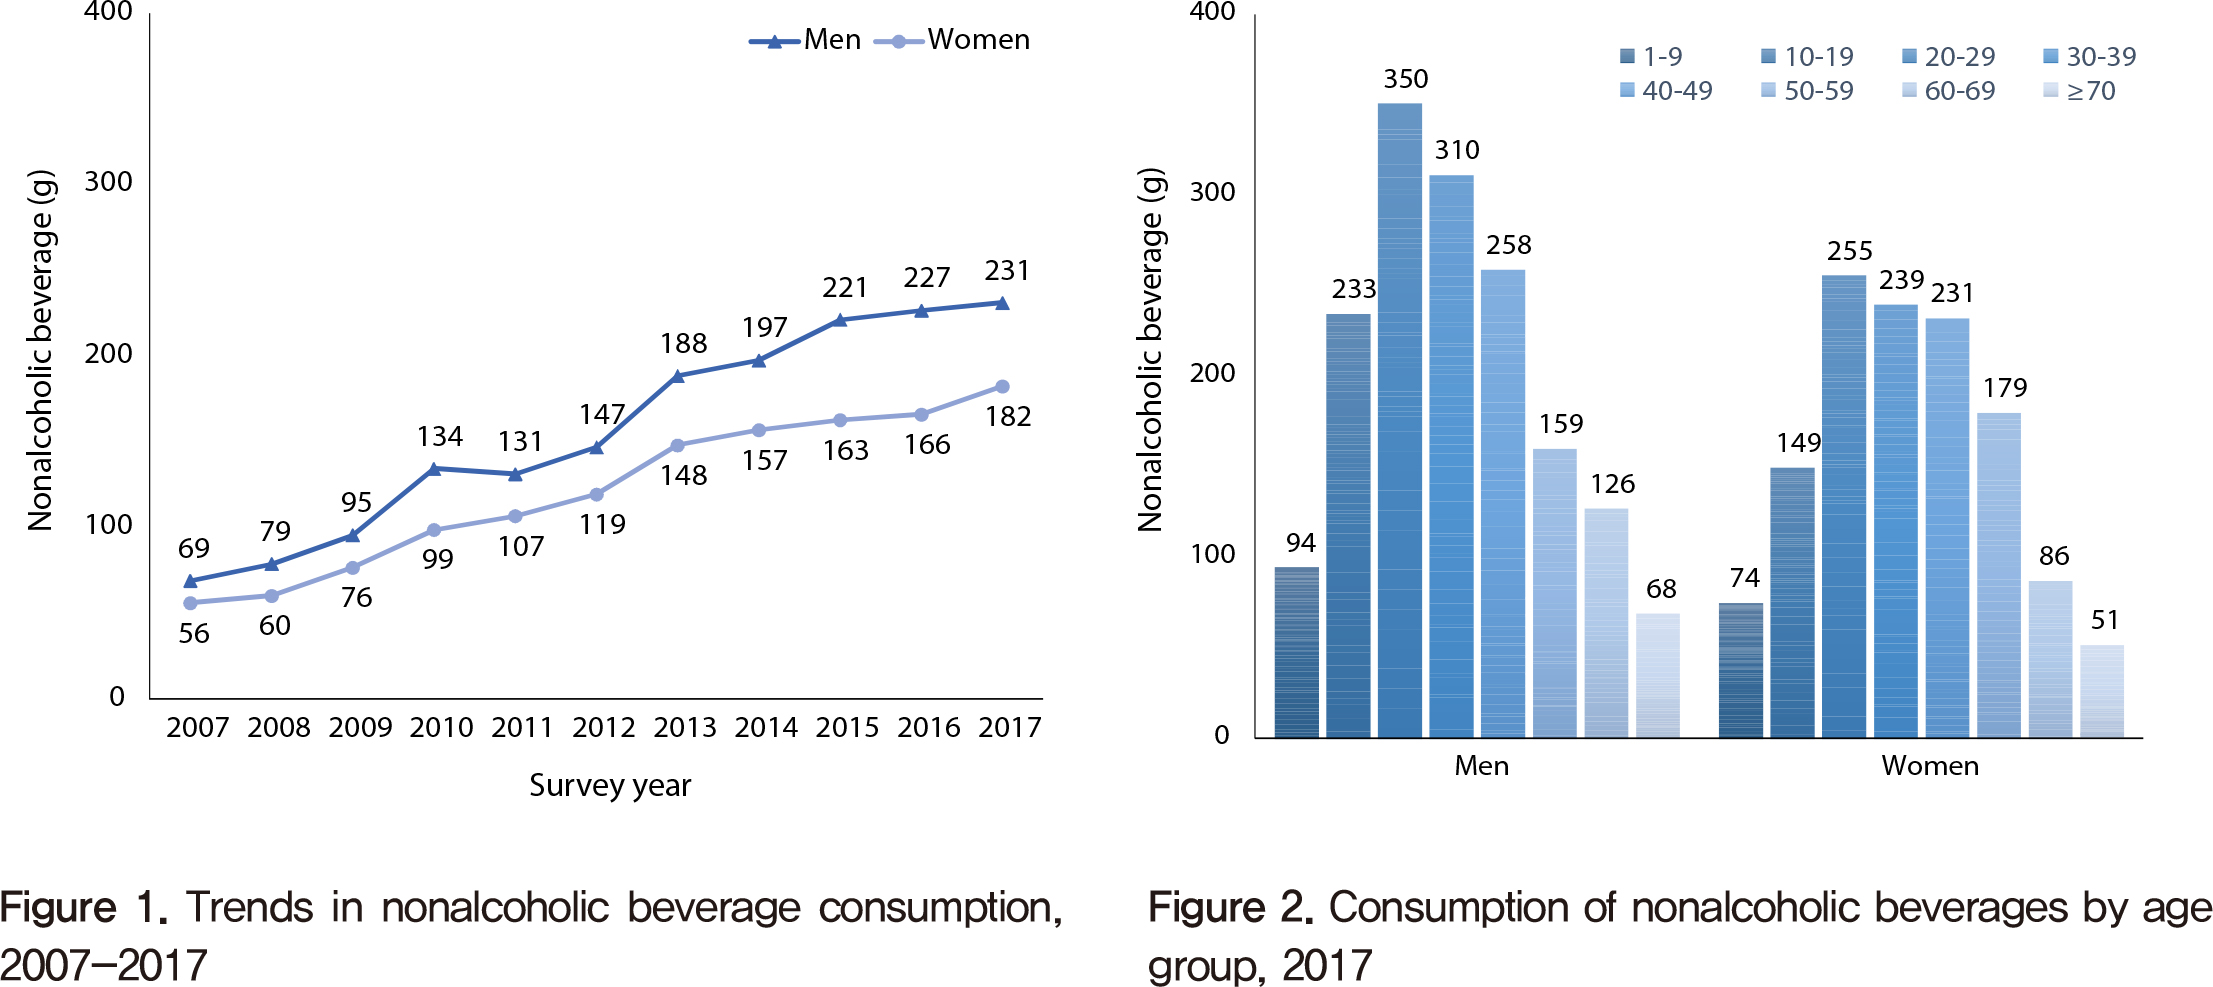
Source: Korea Health Statistics 2017: Korea National Health and Nutrition Examination Survey (KNHANES Ⅶ-2)
Reported by: Division of Health and Nutrition Survey, Korea Centers for Disease Control and Prevention
 This public work may be used under the terms of the public interest source + commercial use prohibition + nonrepudiation conditions