contents area
Press Release
detail content area
- Date2021-02-27 19:23
- Update2021-02-27 19:36
- DivisionDirector for International Affairs
- Tel043-719-7753
|
Local transmission cases as of 0:00 today (cumulative since 3 January 2020) |
|||||||||||||||||||||||||||||||||||||||||||||||||||||||||||||||||||||||||||||||||||||||||||||||||||||||||||||||||||||||||||||||||||||
|
|||||||||||||||||||||||||||||||||||||||||||||||||||||||||||||||||||||||||||||||||||||||||||||||||||||||||||||||||||||||||||||||||||||
|
1) Corrected due to false positive (February 26, 0:00, Gyeongbuk, local transmission -16) |
|||||||||||||||||||||||||||||||||||||||||||||||||||||||||||||||||||||||||||||||||||||||||||||||||||||||||||||||||||||||||||||||||||||
|
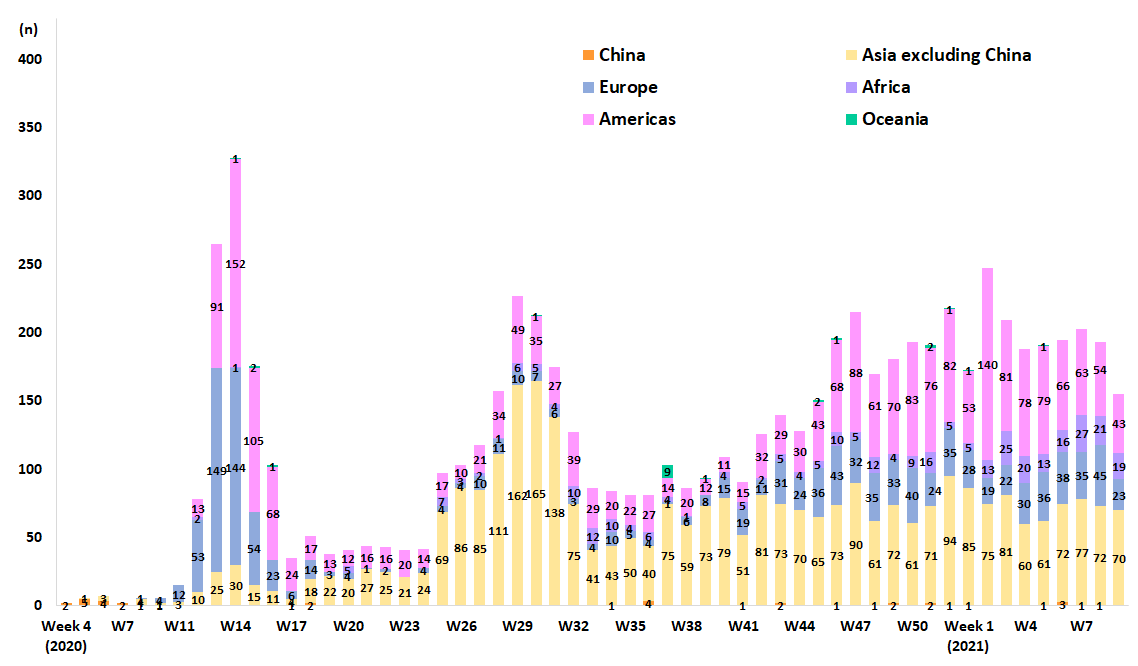
Imported cases, as of 0:00 today (cumulative since 3 January 2020) |
||||||||||||||||||||||||||||||||||||||||||||||||||||||||
|
||||||||||||||||||||||||||||||||||||||||||||||||||||||||
|
* Asia excluding China: Philippines 1, Indonesia 2, India 1, Jordan 2, |
||||||||||||||||||||||||||||||||||||||||||||||||||||||||
|
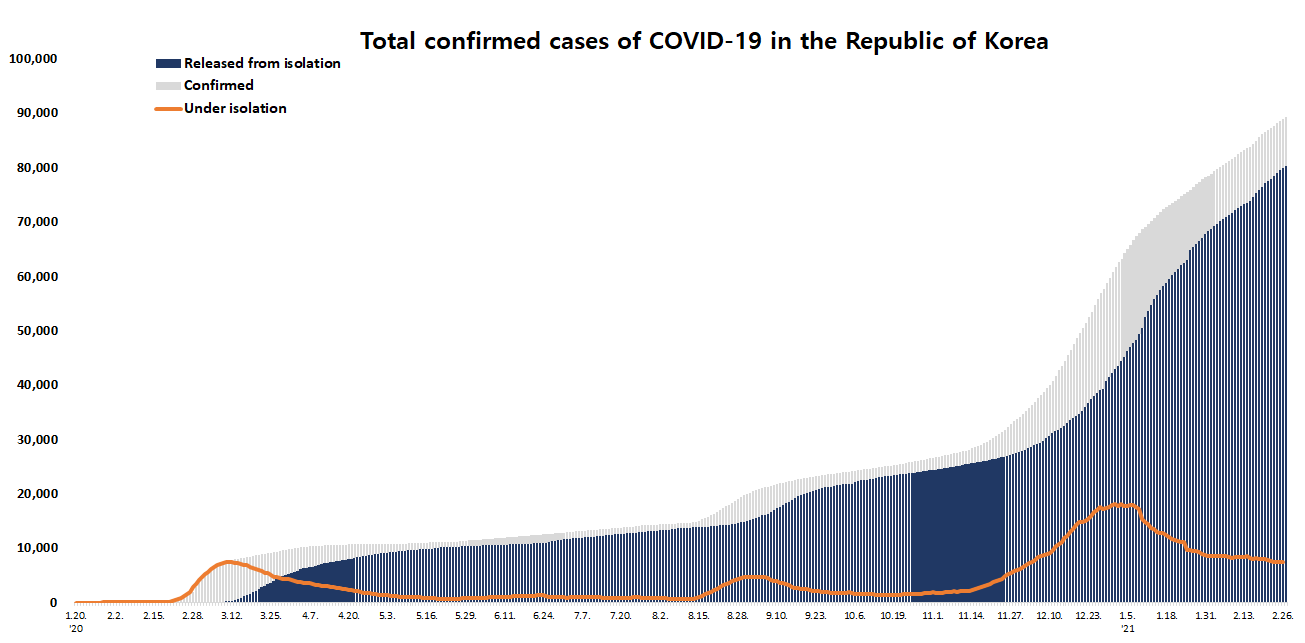
Case status, as of 0:00 today (cumulative since 3 January 2020) |
||||||||||||||||||||
|
||||||||||||||||||||
|
* Based on case data reported to the KDCA ** Severe/Critical: COVID-19 patients in isolation being treated with high flow oxygen therapy, mechanical ventilator, ECMO (Extracorporeal Membrane Oxygenation), CRRT (Continuous Renal Replacement Therapy) ※ Figures subject to correction based on findings from epidemiological investigations 1) Corrected due to false positive (February 26, 0:00, Gyeongbuk, local transmission -16) |
|
Recent major local clusters as of 12:00 today |
||||||||||||||||||||||||||||||||||||||||||||||||||||||||||||||||||||||||||||
|
|
||||||||||||||||||||||||||||||||||||||||||||||||||||||||||||||||||||||||||||
|
* The specific figures may differ from the daily reported statistics or figures disclosed by local municipalities due to factors such as report timing and differences in the time period considered |
|
Weekly risk assessment indicators |
||||||||||||||||||||||||||||||||||||||||||||||||||||||||||||||||
|
||||||||||||||||||||||||||||||||||||||||||||||||||||||||||||||||
|
1) Of the new cases, percent confirmed while under quarantine 2) Reclassified as belonging to a cluster due to epidemiological link found 3) Figure not final due to ongoing investigation ※ All figures subject to change upon new findings from investigation |
||||||||||||||||||||||||||||||||||||||||||||||||||||||||||||||||
|
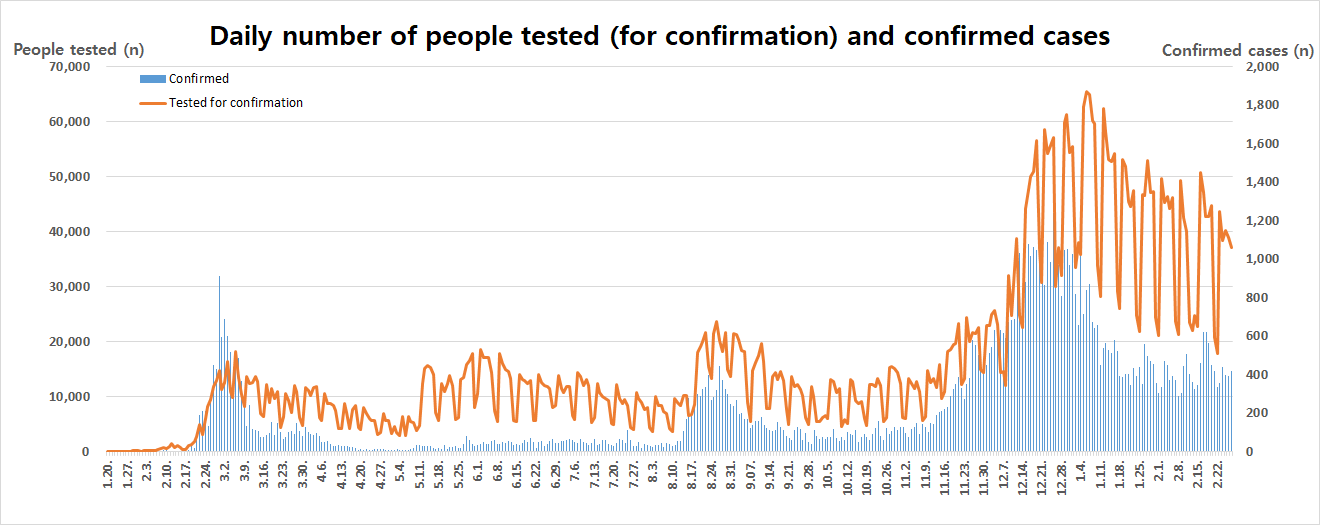
Overall case and test status as of 0:00 today (cumulative since 3 January 2020) |
||||||||||||||||||||||||||||||||||||||||||||
|
||||||||||||||||||||||||||||||||||||||||||||
|
* Based on case data reported to the KDCA ** Testing in progress includes number of completed tests with negative results that are being recorded with delays ※ Figures subject to correction based on findings from epidemiological investigations 1) Corrected due to false positive (February 26, 0:00, Gyeongbuk, local transmission -16) |
||||||||||||||||||||||||||||||||||||||||||||


|
Regional distribution of cases as of 0:00 today (cumulative since 3 January 2020) |
||||||||||||||||||||||||||||||||||||||||||||||||||||||||||||||||||||||||||||||||||||||||||||||||||||||||||||||||||||||||||
|
||||||||||||||||||||||||||||||||||||||||||||||||||||||||||||||||||||||||||||||||||||||||||||||||||||||||||||||||||||||||||
|
* Total (cumulative) number of cases reported since January 2020 of region / Population of region (based on resident registration data of the Ministry of the Interior as of January 2020) * Incidence rate based on the number of confirmed cases with the address of the reporting institution 1) Corrected due to false positive (February 26, 0:00, Gyeongbuk, local transmission -16) |
||||||||||||||||||||||||||||||||||||||||||||||||||||||||||||||||||||||||||||||||||||||||||||||||||||||||||||||||||||||||||
|
Confirmed cases by gender and age group |
||||||||||||||||||||||||||||||||||||||||||||||||||||||||||||||||||||||||||||||||||
※ Figures subject to correction based on findings from epidemiological investigations
1) Corrected due to false positive (February 26, 0:00, Gyeongbuk, local transmission -16) |
||||||||||||||||||||||||||||||||||||||||||||||||||||||||||||||||||||||||||||||||||
|
Deaths by gender and age group |
||||||||||||||||||||||||||||||||||||||||||||||||||||||||||||||||||||||||||||||||||
|
||||||||||||||||||||||||||||||||||||||||||||||||||||||||||||||||||||||||||||||||||
|
AGE DISTRIBUTION OF SEVERE/CRITICAL CASES |
||||||||||||||||||||||||||||||||||
|
||||||||||||||||||||||||||||||||||
|
|
Severe/Critical |
( |
% |
) |
||||||||||||||||||||||||||||||
|
Total |
142 |
( |
100.0 |
) |
||||||||||||||||||||||||||||||
|
80 and above |
35 |
( |
24.8 |
) |
||||||||||||||||||||||||||||||
|
70-79 |
50 |
( |
35.5 |
) |
||||||||||||||||||||||||||||||
|
60-69 |
38 |
( |
27.0 |
) |
||||||||||||||||||||||||||||||
|
50-59 |
16 |
( |
11.3 |
) |
||||||||||||||||||||||||||||||
|
40-49 |
1 |
( |
0.7 |
) |
||||||||||||||||||||||||||||||
|
30-39 |
1 |
( |
0.7 |
) |
||||||||||||||||||||||||||||||
|
20-29 |
0 |
( |
0.0 |
) |
||||||||||||||||||||||||||||||
|
10-19 |
0 |
( |
0.0 |
) |
||||||||||||||||||||||||||||||
|
0-9 |
0 |
( |
0.0 |
) |
||||||||||||||||||||||||||||||
* Severe/Critical: COVID-19 patients in isolation being treated with high flow oxygen therapy, mechanical ventilator, ECMO (Extracorporeal Membrane Oxygenation), CRRT (Continuous Renal Replacement Therapy)
* ICU treatment is decided based on the need for intensive care based on factors such as clinical condition and presence of any underlying medical condition and may differ from severe and critical case classification criteria. The number of severe/critical cases may not match the number of patients in ICU.
※ Figures subject to correction based on findings from epidemiological investigations
NEW CASES (LAST 2 WEEKS) BY CHAIN OF TRANSMISSION

IMPORTED CASES

|
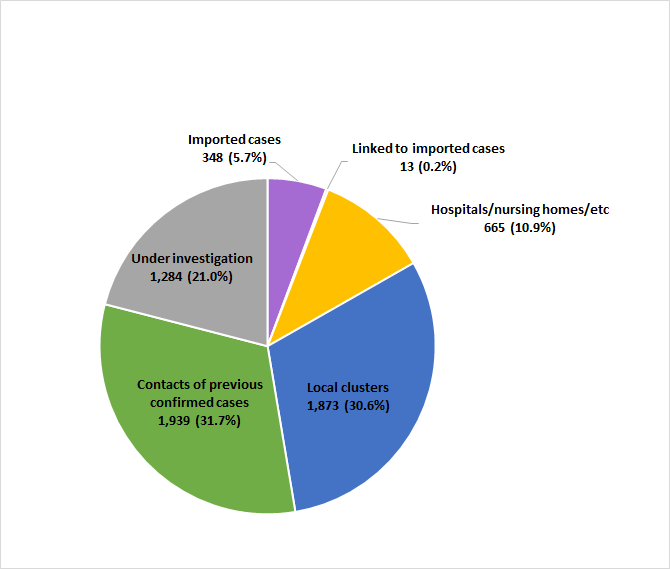
REGIONAL DISTRIBUTION AND EPIDEMIOLOGICAL LINKS OF CONFIRMED CASES |
||||||||||
|
|
||||||||||
|
Region |
Confirmed cases |
Other major clusters |
||||||||
|
Total |
Imported cases |
Clusters |
Other* |
Under investigation |
New cases |
|||||
|
Sub- total |
Shin- cheonji cluster |
Other local clusters |
Imported related |
|||||||
|
Seoul |
28,120 |
925 |
10,488 |
8 |
10,381 |
99 |
9,245 |
7,462 |
131 |
Past large clusters: • Sarang Jeil Church (1173) • Aug 15 Seoul rallies (650) • Seoul Gangseo-gu dance lessons (329) • Seoul Jongno-gu restaurant / singing class (315) • Nightclubs (277) • Yongjin Woori Jeil Church (221) • Richway (210) • Guro-gu call center (170) • Coupang fulfillment center (152) • Gwangju door-to-door sales (150) • Seoul Noryangjin teacher appointment exam preparation classes (112) • Newly planted churches group (119) • Gangseo-gu religious facility (258) • Chungbuk hospitals (472) • Gyeongbuk Sangju-si BTJ (808) • Busan/Ulsan janggu lessons (268) • Gyeongnam Jinju-si prayer house (120) • Yongsan-gu construction site (123)
|
|
Busan |
3,218 |
133 |
2,012 |
12 |
1,943 |
57 |
636 |
437 |
9 |
|
|
Daegu |
8,618 |
151 |
6,385 |
4,512 |
1,866 |
7 |
1,137 |
945 |
6 |
|
|
Incheon |
4,418 |
231 |
2,087 |
2 |
2,075 |
10 |
1,358 |
742 |
27 |
|
|
Gwangju |
2,070 |
127 |
1,662 |
9 |
1,647 |
6 |
135 |
146 |
12 |
|
|
Daejeon |
1,189 |
54 |
641 |
2 |
638 |
1 |
312 |
182 |
2 |
|
|
Ulsan |
1,008 |
90 |
717 |
16 |
697 |
4 |
125 |
76 |
3 |
|
|
Sejong |
220 |
25 |
98 |
1 |
96 |
1 |
53 |
44 |
1 |
|
|
Gyeonggi |
23,412 |
1,497 |
9,274 |
29 |
9,166 |
79 |
7,956 |
4,685 |
169 |
|
|
Gangwon |
1,860 |
74 |
1,053 |
17 |
1,035 |
1 |
477 |
256 |
6 |
|
|
Chung- buk |
1,746 |
89 |
936 |
6 |
923 |
7 |
452 |
269 |
8 |
|
|
Chung- nam |
2,437 |
157 |
1,279 |
0 |
1,278 |
1 |
603 |
398 |
4 |
|
|
Jeonbuk |
1,184 |
106 |
836 |
1 |
834 |
1 |
127 |
115 |
20 |
|
|
Jeonnam |
859 |
69 |
607 |
1 |
595 |
11 |
100 |
83 |
5 |
|
|
Gyeong- buk |
3,251 |
153 |
2,280 |
565 |
1,714 |
1 |
479 |
339 |
7 |
|
|
Gyeong- nam |
2,181 |
149 |
1,364 |
33 |
1,298 |
33 |
373 |
295 |
1 |
|
|
Jeju |
569 |
33 |
358 |
0 |
357 |
1 |
103 |
75 |
1 |
|
|
Points of Entry |
2,961 |
2,961 |
0 |
0 |
0 |
0 |
0 |
0 |
3 |
|
|
Total |
89,321 |
7,024 |
42,077 |
5,214 |
36,543 |
320 |
23,671 |
16,549 |
415 |
|
|
(%) |
(7.9) |
(47.1) |
(5.8) |
(40.9) |
(0.4) |
(26.5) |
(18.5) |
|||
|
* Includes contacts of confirmed cases ※ The interim classification is based on the reporting location, which may change depending on further epidemiological investigation. |
||||||||||
 This public work may be used under the terms of the public interest source + commercial use prohibition + nonrepudiation conditions